

AI-Powered Marketing Orchestration
in One Platform
Activate 1st-party data, orchestrate connected customer journeys, and drive results across multiple channels.
The Integrated Marketing Platform Enriched by Complete Customer Data
Advertising and email campaigns work together seamlessly, leveraging customer data
maintained in a single, easy-to-use platform.

Remove
Data Silos
Unify 1st-party data to create multi-channel campaigns with information-rich, relevant audiences.

Connect Fragmented
Channels
Build highly-personalized programmatic and email campaigns that engage audiences through the entire customer journey.

Eliminate
Reporting Gaps
See real-time performance analytics across channels to track attribution, measure impact, and optimize spend.
Programmatic Advertising,
Made Easy
Flexible, Intelligent Targeting
Activate 1st-party audiences, leverage contextual targeting, reach key accounts with ABM targeting, and so much more.

Real-Time Forecasting
Predict impressions, reach, clicks, and conversions with live campaign modeling for optimal campaign outcomes.
Dynamic Ad Creative
Automatically tailor creative to your audience’s preferences, behaviors, and context.

Maximize Productivity With Your
StackAdapt AI Assistant
Save time and effort with IvyTM, the AI assistant that helps you plan, launch, and optimize your marketing campaigns.
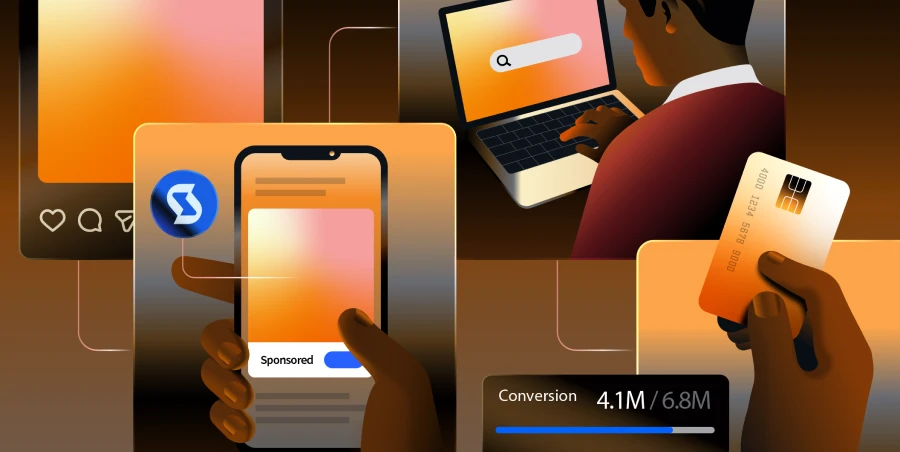
Hyper-Personalized Advertising
and Email Marketing
Connect programmatic advertising and email into one seamless customer journey.
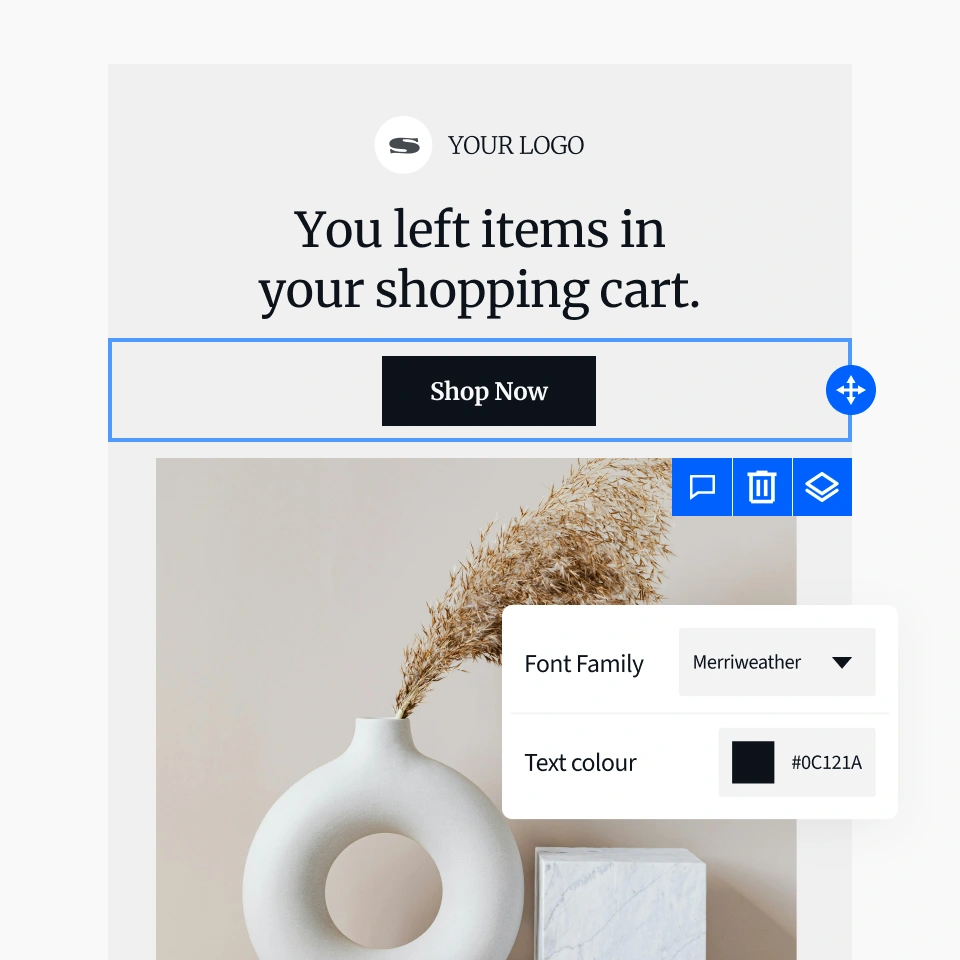

Start from scratch, import HTML templates, or edit pre-built email templates in the drag-and-drop StackAdapt editor.
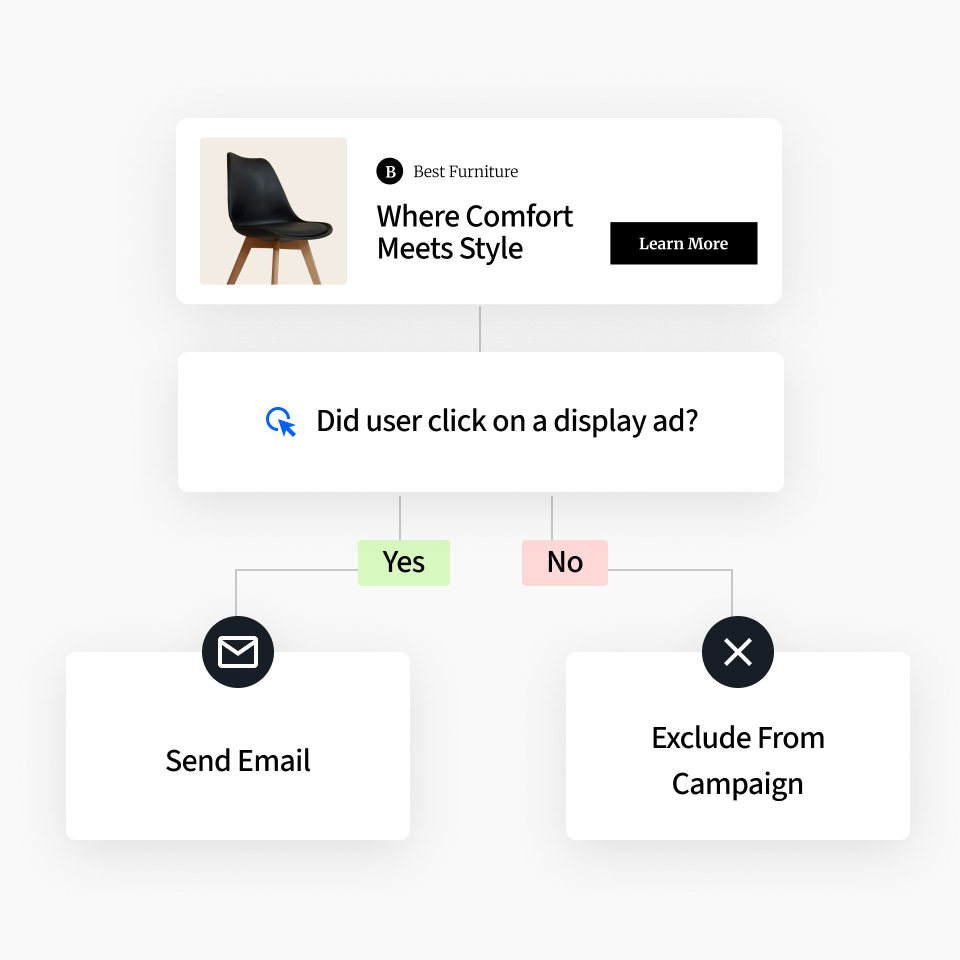
Orchestrate your ads and emails to work together. When a user engages with your programmatic ad, follow up with a personalized email.
View campaign performance across programmatic and email in a single, customizable dashboard.
Get More Value From Your Customer Data
With The StackAdapt Data Hub
Centralize your customer data and maintain a complete, holistic view of their journey throughout the funnel.
Automate 1st-party data flow with seamless CRM integrations, eliminating manual and repetitive data uploads.
Target high-intent audiences and deliver personalized messaging without a reliance on third-party cookies.

Why The Most Exceptional Marketers Are Switching to The Fastest-Growing, Integrated Marketing Platform
“[StackAdapt’s] programmatic expertise allowed us to deliver ads to the right customers at the right time, exceeding our goals for impressions and conversions—all while staying within budget.”
David Carey
Chief Technology Officer
“We really enjoy using the CRM upload feature on StackAdapt because we’re able to upload and use our 1st-party data quickly. Not to mention, the match rates we get on StackAdapt are the highest that we get anywhere.”
Trey Byers
Director of Digital Marketing
“We saw a 77% reduction in cost per click, driven by StackAdapt’s data insights and quick audience implementation. Our campaigns now hit the mark efficiently, ensuring our client’s message resonates with precision.”
Mason Allen
Senior Programmatic Analyst
“StackAdapt Brand Lift made it easy for us to define the success of our brand awareness campaigns, which had been a huge challenge for us in the past.”
Joey Vara
Associate Director of Paid Media
Read How StackAdapt Clients Drive
Successful Campaigns

Popeyes Increases ROAS by 680% With Programmatic Strategy

Octopus Energy Boosts Brand Awareness With DOOH Campaign

Securing Conversions and Exceeding CPA Goals With B2B Targeting
Frequently Asked Questions
Marketing teams who need to plan, launch, and optimize digital advertising across multiple channels and incorporate email marketing into the mix. Whether building full-funnel programmatic strategies or orchestrating personalized email journeys, marketers can leverage StackAdapt’s AI-powered workflows and 1st-party Data Hub in one user-friendly platform to drive measurable results. Agencies manage personalized, cross-channel campaigns for clients, while brands unify their media and messaging end-to-end. To learn more, request a demo today.
StackAdapt is an integrated marketing platform because it lets you manage campaigns across multiple channels, such as DOOH, mobile apps, CTV, and email, while keeping your audience and data connected in one place. With shared tracking and insights, all your marketing efforts work together smoothly to reach and engage people at every step of their journey. To see it for yourself, request a demo today.
StackAdapt offers flexible pricing models tailored to your campaign objectives, including CPM (cost per mille), CPC (cost per click), and CPE (cost per engagement). To learn more about what StackAdapt offers, explore our plans and packages or request a demo today to connect with our team.


